
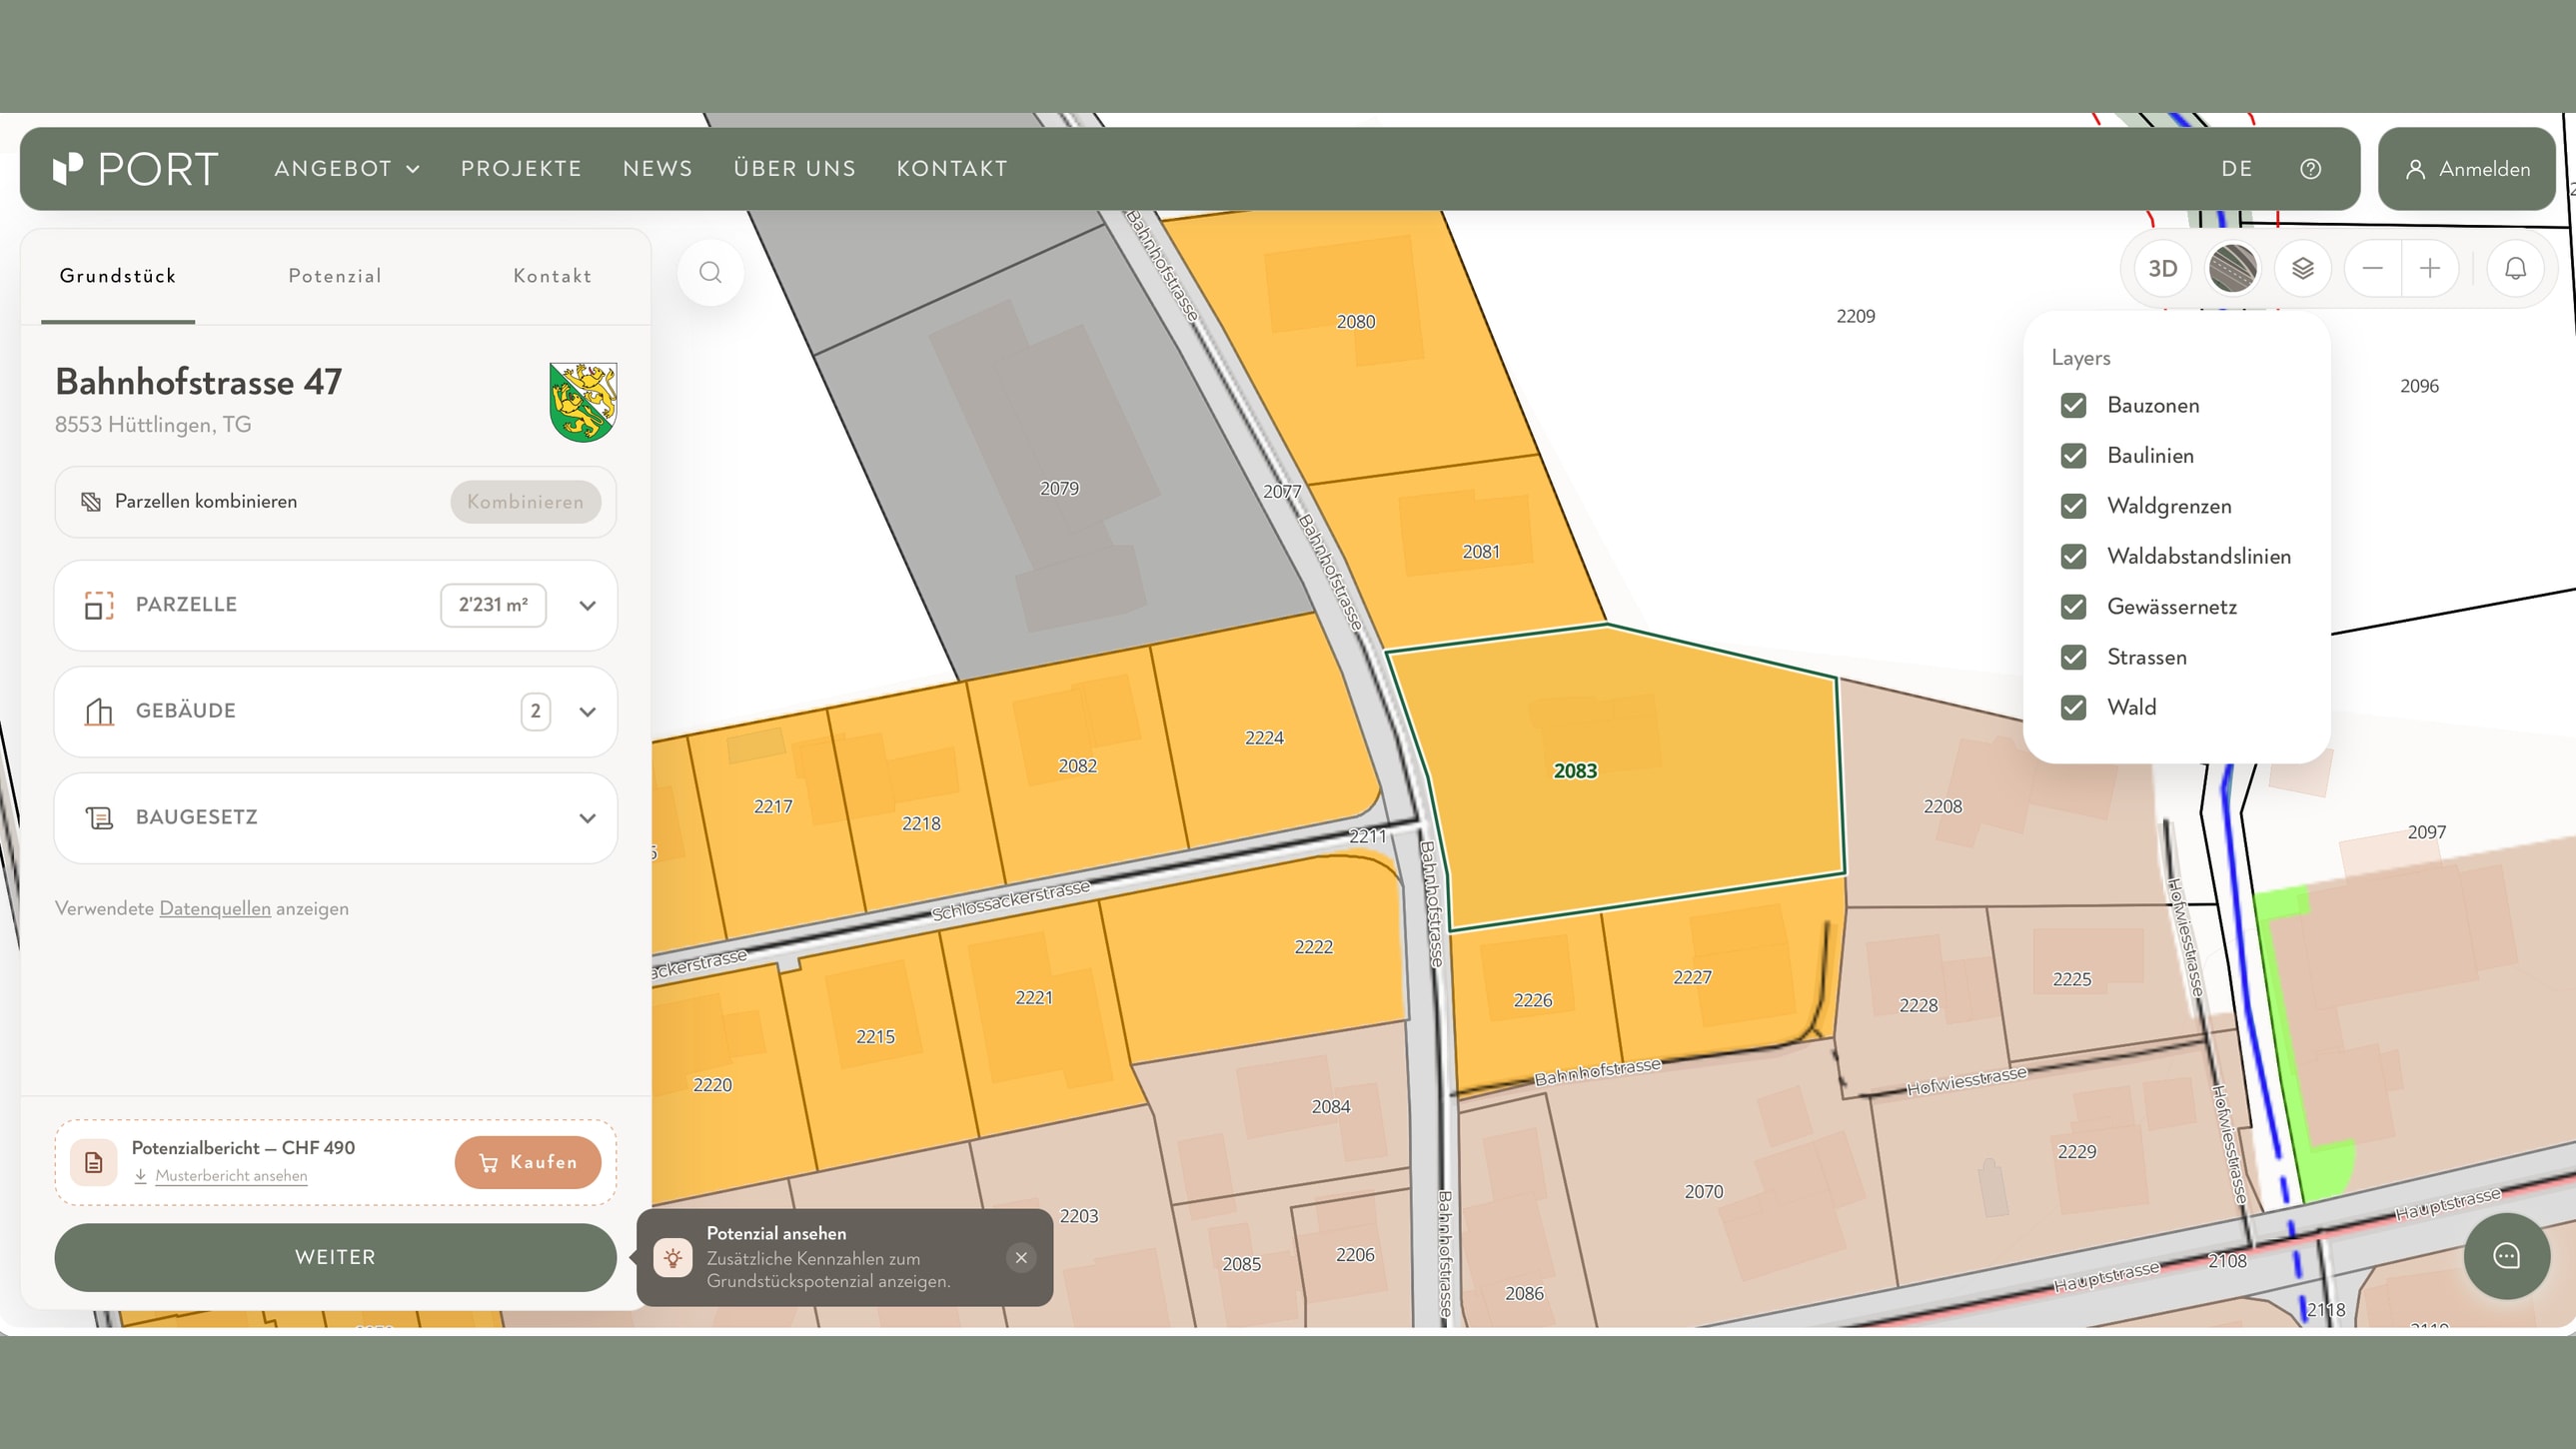
Reading a building zone plan – what it really reveals about your plot
For many owners, the building zone plan is a document they looked at once when buying their plot – and never again. Yet it holds some of the most important answers of all: What is permitted on a plot? What is restricted? What is ruled out?
The building zone plan – often simply called the zoning plan – looks abstract at first glance: a colourful map with abbreviations, lines and symbols. In reality, it is a precise source of information. Anyone who can read it understands within a few minutes the framework that applies to their own property – and where questions might be worth asking.
We show what the zoning plan contains, where to find it and how to interpret the most important information correctly.
What a zoning plan is
The building zone plan – part of municipal land-use planning – divides the municipal territory into zones. Each zone determines whether and how a plot may be built on or used. Together with the building and zoning regulations (BZO), it forms the legal framework for everything that may happen on a plot. In other cantons, these regulations go by a different name, for example building regulations.
Good to know: the zoning plan is not a static document. Municipalities revise their land-use planning periodically, usually as part of local planning revisions. What applies today may be amended in a few years – sometimes in favour of a particular plot, sometimes to its detriment.
Where to find your zoning plan
Today, the easiest access is via the internet:
- Cantonal geoportals: Almost all cantons make their land-use planning available online – usually under keywords such as «Geoportal», «GIS browser» or «map viewer».
- PLR cadastre: The official extract for your plot. It shows the zone, building lines, noise and protection requirements at a glance – free of charge as a PDF in most cantons.
- Municipal website: Many municipalities link to their land-use planning directly on their own website, often in the «Building» or «Planning» section.
- Your municipality's building administration: For binding information, especially during ongoing revisions, the building administration is the right place to go.
- Digital potential analyses: Platforms such as PORT's automatically combine zoning, building law and geodata – you enter an address and receive the zone together with an assessment of what it means for the plot.
For a first look, the cantonal geoportal or the PLR cadastre extract is enough. Anyone who wants to know not only which zone the plot is in, but also what follows from it, reaches their goal faster with a structured analysis.
Understanding colours – which zone applies
The colour of a plot in the zoning plan indicates the zone type. The specific colours differ between cantons and municipalities. The basic logic, however, is comparable everywhere:
- Residential zones stand for residential use, usually at different density levels.
- Mixed zones combine housing with commercial use or services.
- Core zones are typically located in historically grown parts of town and often come with special design requirements.
- Commercial and industrial zones are reserved for economic use.
- Zones for public buildings include schools, administrative buildings, sports facilities.
- Agricultural zones lie outside the building area. New buildings are only permitted here under strict conditions.
The legend of the zoning plan translates the colours into plain language. Without a look at the legend, any interpretation remains speculation.
Reading abbreviations and numbers
Besides the colour, each zone carries an abbreviation – for example W2, W3, WG3 or K. These abbreviations are the key to the specific building requirements.
- In many municipalities, W stands for residential zone.
- WG combines residential and commercial use.
- K often denotes a core zone.
- The number (2, 3, 4 …) typically refers to the permitted number of storeys or the density level.
Important: a «W2» in one municipality does not necessarily correspond to a «W2» in the neighbouring municipality. The specific requirements – permitted number of storeys, building height, density index, distances – are not stated in the zoning plan itself, but in the building and zoning regulations of the respective municipality. These are usually available as a PDF on the municipal website and are the actual reference work. We explain which density indices exist and how they work in a separate article.
In short: the zoning plan shows which zone applies. The building and zoning regulations explain what that means in concrete terms.
Recognising lines, distances and boundaries
Between the coloured areas lie lines. They seem secondary, but are often decisive for what can actually be built:
- Building lines determine where a building may be placed – or not.
- Road setbacks determine how close a building may come to the road.
- Watercourse distance lines protect streams, rivers and riparian areas.
- Forest distances apply even where a forest is not obviously perceived as such – because even a group of trees can legally be forest.
- Zone boundaries separate different uses – sometimes right through the middle of a plot.
If a plot is intersected by such a line, its theoretical potential can be reduced considerably. A large plot by a stream simply cannot be built on to the same extent everywhere.
Watch out for symbols and special zones
In addition to colours and lines, the zoning plan contains symbols and overlays that are easily overlooked – and yet have a major impact:
- Protection of the townscape or of historically valuable ensembles
- Heritage protection of individual buildings
- Noise sensitivity levels: they determine how much noise is permissible in a zone
- Groundwater protection zones
- Nature and landscape protection areas
- Obligation to prepare a design plan or special land-use plan for certain sites
Not all of this is shown in the zoning plan itself; the PLR cadastre brings it together. Such overlays often restrict what would normally be permitted or require additional procedures. They are the most common reason why a plot that looks attractive at first glance offers less leeway than expected on closer examination – or, conversely, why something suitable can still emerge from a difficult starting position with the right procedure.
Why W3 is not automatically W3
An example makes the limits of the zoning plan visible. Two plots, both in a residential zone «W3»:
- Plot A is located on a wide access road in an established neighbourhood without protection requirements; it is rectangular and has its own access.
- Plot B is located in a townscape protection area, adjacent to a stream with a watercourse distance line. It is narrow, accessible only via the neighbouring property and also heavily exposed to noise.
On paper, the zone is identical. The actual development leeway differs massively. The zoning plan shows both as «W3» – the differences lie in lines, symbols, plot shape, access and in the building and zoning regulations.
That is why: the zone is the starting question, not the answer.
How to proceed
A pragmatic initial check consists of five steps:
- Open the zoning plan via the cantonal geoportal, the PLR cadastre or the municipal website.
- Locate the plot and note its colour and abbreviation.
- Check the legend: Which zone exactly is this? Which symbols and lines lie on or around the plot?
- Consult the municipality's building and zoning regulations: What specifically applies to this zone in terms of number of storeys, density, height and distances?
- Document anything conspicuous: protection requirements, building lines, special land-use obligations – everything that affects the leeway.
The result is a solid basis for any further discussion: with an architecture firm, developer, bank or buyers.
By the way: these five steps can also be shortened. The PORT potential analysis automatically brings together the zoning plan, the building and zoning regulations and other base data – and instead of a colourful map, provides an assessment of what might actually be possible on the plot.
Reading is good – interpreting is better
With a little practice, you can read a zoning plan yourself. The right interpretation, however, requires experience. Colours, abbreviations, lines and symbols must be read in conjunction with the building and zoning regulations, plot shape, access and local practice. Another article in our series shows when a design plan comes into play.
Anyone who has consciously opened and understood the zoning plan once asks different questions afterwards. And that is exactly the point: asking the right questions before time and money flow into an idea that may not even be feasible on this plot.
Would you like to know what the building zone plan says about your plot – and what can concretely be derived from it? With the PORT potential analysis, you get an initial, well-founded assessment in just a few minutes – with just your address.
TO THE PORT PLATFORM